

The Nifty 50 just completed its eighth straight weekly decline—the longest losing streak since 2001. Foreign investors have pulled over ₹3 lakh crore from Indian equities this year, the rupee is weakening, crude oil is above $100, and US bond yields are at two-decade highs. But are we near a bottom? Here’s what the data says.
The Numbers That Tell the Story
Indian equity markets have been under relentless pressure, and the latest data paints a sobering picture.
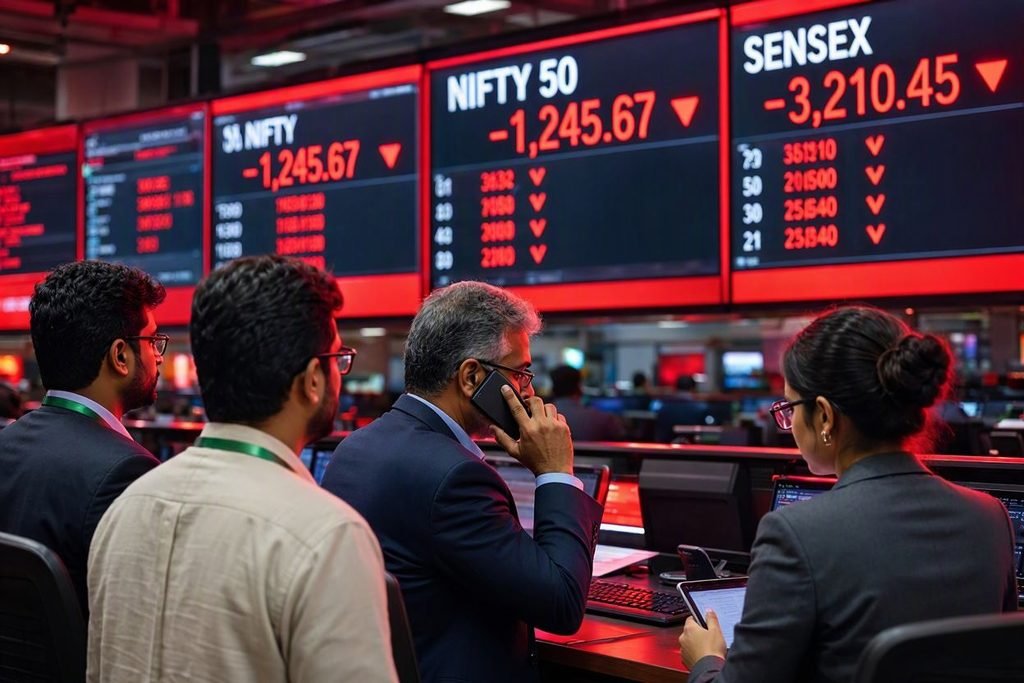
On Thursday, October 1, 2026—the final trading session before markets closed for Gandhi Jayanti—the Nifty 50 fell 198.50 points (0.88%) to close at 22,421.95, while the Sensex declined 570.59 points (0.79%) to 71,909.70 . For the week, the Nifty dropped 3.1% against the previous Friday’s close of 23,140.5 .
But the weekly loss is only part of the story. This marked the eighth consecutive weekly decline for the Nifty—the longest losing streak in 25 years, according to multiple reports . The index has now fallen nearly 14% in 2026, putting it on track for its worst annual performance since 2011 .
What’s Driving the Selloff?
1. Foreign Investors Are Fleeing
The single most important factor weighing on Indian equities is the unprecedented exodus of Foreign Institutional Investors (FIIs). Here’s the scale of the outflow:
| Period | FII Outflow |
|---|---|
| September 2026 | $4.1 billion |
| CY2026 Year-to-Date | $28.3 billion |
| First 9 Months of 2026 | Over ₹3 lakh crore (record) |
According to NSDL data, FIIs have sold more than ₹3.05 lakh crore from Indian equities in the first nine months of 2026 alone—surpassing all previous annual outflow records with three months still remaining . This is the first time secondary market outflows have crossed the ₹3 lakh crore mark.
Motilal Oswal’s institutional flows data reveals the broader picture: between October 2024 and September 2026, FIIs withdrew approximately $56 billion** from Indian equities—effectively wiping out the cumulative FII inflows of the previous eight years . Cumulative foreign institutional flows between October 2016 and September 2026 now stand at **negative $0.6 billion.
On September 30 alone, FIIs sold ₹10,148 crore—their biggest single-day outflow in six months .
2. US Bond Yields Are at Two-Decade Highs
The US 10-year Treasury yield has maintained an upward bias, staying elevated and reducing the relative attractiveness of emerging-market equities . Gautam Duggad of Motilal Oswal explained: “Rising US bond yields, a stronger dollar and shifting expectations around global interest rates have reduced the relative attractiveness of emerging-market equities” .
The surge in global bond yields is also adding pressure on the RBI to consider tightening measures at its October meeting, as inflation risks mount .
3. Crude Oil Remains Above $100
Brent crude has continued to trade above $100 per barrel, creating upward pressure across sectors ranging from consumer goods to transportation . For India, which meets around 80% of its crude oil demand through imports, this directly worsens the trade deficit and fuels imported inflation .
The oil price surge began in February when the US launched attacks on Iran, completely changing the domestic equity backdrop for the worse . The longer crude remains elevated, the weaker the chances of a sustained market recovery.
4. The Rupee Is Weakening
The depreciating rupee has added to investor caution. The currency has been hovering near historic lows, squeezing margins for import-dependent sectors and discouraging foreign investment . A weaker rupee makes dollar-denominated returns for foreign investors even worse, compounding the incentive to exit.
5. Limited AI Exposure
Unlike other major Asian markets such as South Korea, Japan, and Hong Kong—which have registered multiple record highs, supported by chip stocks and AI-centric investments—India has limited exposure to the AI boom . This has prompted many investors to reallocate money to markets like Taiwan and South Korea.
The Domestic Cushion: DIIs and SIPs
While FIIs have been relentless sellers, Domestic Institutional Investors (DIIs) have provided a critical counterbalance. The data reveals a striking “tug of war”:
| Metric | FIIs | DIIs |
|---|---|---|
| September 2026 | -$4.1 billion | +$8 billion |
| CY2026 YTD | -$28.3 billion | +$67.8 billion |
| Last 24 Months | -$56 billion | +$177 billion |
Over the past 24 months, DIIs invested a record $177 billion in Indian equities—23% higher than the cumulative DII inflows over the preceding eight years . Monthly SIP (Systematic Investment Plan) contributions have risen steadily to around ₹32,000 crore, providing a cushion against relentless foreign selling .
On September 30, DIIs bought ₹11,271 crore, more than offsetting the FII outflow of ₹10,148 crore . For the entire month of September, DII buying of approximately ₹76,030 crore was equivalent to roughly 173% of FII selling .
However, despite this massive domestic support, the market has continued to fall. The reason: FII selling is concentrated in index heavyweights—large-cap stocks that directly determine the Nifty’s direction—while DII buying is spread across sectors, diluting its index-level impact.
The Technical Picture: Are We Near a Bottom?
Despite the bearish sentiment, several technical indicators suggest the market may be approaching a short-term bottom.
Critical Support Zone
SBI Securities’ Sudeep Shah identifies the 22,150–22,100 zone as the crucial support area for the Nifty . The price action around this zone will determine the next directional move. Shah notes that the gap between the current price and the 20-day EMA has widened beyond 4%, while the daily RSI has approached oversold territory. “Historically, such stretched readings have often resulted in either a pullback rally or a phase of consolidation before the broader trend resumes” .
Other analysts place immediate support at 22,200–22,000, with resistance at 22,600–22,800 . The convergence of long-term technical references makes the 22,200–22,600 region a critical zone for the coming week .
The 200-Week Moving Average Breach
One concerning development: the Nifty has modestly violated its 200-week moving average, presently placed at 22,606.97 . This is a significant technical signal that the medium-term structure has weakened.
However, Shah suggests that the probability of a decisive breakdown below 22,000 in the immediate week appears relatively low. The index has already undergone a sharp 14% correction in 2026 and extended its losing streak to eight consecutive weeks, making it significantly stretched on the downside .
The Oversold Argument
Multiple analysts point to oversold conditions. The Nifty has fallen 6.1% in September alone—its second-steepest monthly fall since October 2024 . The index is now testing the 80% retracement zone of its prevailing up move between 22,182 and 24,774, which coincides with a rising trendline and the 200-week exponential moving average around 22,400, creating what Choice Broking describes as a strong support confluence .
What Could Trigger a Recovery?
1. RBI Policy Decision (October 7)
The RBI Monetary Policy Committee is scheduled to meet from October 5–7, with the policy decision due on October 7 . With inflation risks mounting due to elevated crude prices, the market will be watching closely for signals on interest rate direction.
2. US Midterm Elections and Bond Yields
Some experts believe the US 10-year Treasury yield could top out in October ahead of the US Midterm Elections on November 3, 2026 . Pressure on the US government to justify soaring inflation, defence expenditure, and the debt crisis—which has crossed $40 trillion—may lead to policy responses that could ease yield pressures .
3. Festive Season and Earnings
October has historically been a stronger month for Indian equities, partly due to expectations of higher festive-season spending on automobiles, jewellery, and consumer durables . Over the past decade, the Sensex and Nifty have delivered average October gains of around 1% .
The September-quarter earnings season starting in October will be closely watched for signs of improvement in corporate profitability, particularly among large-cap stocks that have underperformed .
What Should Investors Do?
For Long-Term Investors
Bajaj Alternate Investment Management notes that India’s long-term structural outlook continues to improve. With NPAs at all-time lows in the banking sector and corporate balance sheets significantly stronger, India’s GDP is poised to surprise on the upside .
The brokerage suggests that after the near-term correction, attention should shift to festive season demand, spending ahead of the UP election, and the 8th Pay Commission pay increase in the medium term .
For Short-Term Traders
Analysts recommend a cautious approach. Shah advises watching the 22,150–22,100 support zone closely—holding above this band could trigger a technical rebound toward 23,300–23,500, while a decisive break below could open the door to 22,000 and lower .
The Bottom Line
The Indian stock market is experiencing its most challenging period in over a decade. Foreign investors have pulled unprecedented amounts of capital, global headwinds remain fierce, and technical indicators are stretched. Yet domestic institutional buying and SIP flows provide a powerful cushion, and oversold conditions suggest a near-term bounce is possible.
The coming weeks will be critical. The RBI policy decision, US bond yield movements, crude oil prices, and Q2 earnings will determine whether October marks the bottom—or just another chapter in this painful correction.